How to use the map
Using the left panel, you can combine information corresponding to the notifications selected and show it on the map.
Select the checkboxes related to each area to display the shape of different location(s) on the map:

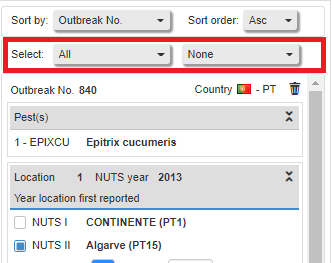
Alternatively you can use the Select All/None feature, by selection from the All dropdown list the criteria you want to include and from the None dropdown list the criteria you want to exclude.
If you hover your mouse over the location’s name on the left, the corresponding area will be highlighted in red (by default) on the map:

Use the options below each location’s name to:
Change the colour and opacity of the shapes outline
Fill the shapes and change their colour and opacity
All these actions are reversible and can be undone by unchecking the related boxes:

To narrow your view to the area of the outbreak, select the LAU location and click on the zoom drawing button. The map will zoom on the selected area:

You are also able to import your GIS coordinates in the map. They will be retrieved from your notification:

Select it, to place a marker on the map and identify your location:

Right click on it to modify its settings:

From here, you can delete it, bring it to back or to front and change its properties. Click on “Properties” to modify your coordinates or change the marker’s colour:

Select the GPS Key Coordinates to add the shapes of the infested area and the buffer zone that the user drew in the notification:

If you hover your mouse over the shape on the map, the area will be highlighted and the number of outbreaks present in that area will pop up:

Right click on the shape to open an information box:

Click on the notification number to show the characteristics of the selected NUTS shape:


The previous example was based on the selection of a LAU location (the narrowest area) butthe same search can be done also for the other locations.
In case of a broader region, like a NUTS II, you may find the presence of an higher number of outbreaks in the same area.
Here, the outbreaks present in that specific NUTS location are 5 and if you right-click on the shape, you will have the list of the outbreaks.
As explained before, just click on the one that you are interested in, to display its characteristics and, if needed, also download the PDF of the notification:

You can further search for locations and mark them directly on the map using the buttons on the map’s top right corner, as shown in the instructions here below:

The first icon will highlight the area and the second icon will place a mark on it:

Note
You can move the marker by changing the coordinates for latitude and longitude.

After you have highlighted the areas of your interest on the map, you can use the button "User Definable Legend" to create a legend to identify markers, polygons, and circles on the map:

Select what you want to add – a marker, a polygon, or a circle:

A pop-up will appear for you to attribute a label to the marker, circle, or polygon. You can also change their color.

Note
On the right side of the screen you have the description of the legend for shapes:


Instead of drawing the shapes, you have the option to import them from the GIS tool.
To do it, follow these steps:
Click on the Add Markers/Polygons icon:

A pop-up window will appear for you to select if you want to add a marker or a polygon, the pest, the start and end dates and the regional level:

The marker or polygon will be placed in the region(s) where the pest is present:

